Google Web Components a Polymer approach — A step-by-step guide
This post is to explain how to obtain a Google API — Client ID — to run the Google Web Components utilizing the Polymer code.
<google-signin client-id="YOUR_CLIENT_ID_HERE"></google-signin>
<google-analytics-dashboard>
  <google-analytics-chart type="pie" ids="ga:YOUR_ID" metrics="ga:sessions" dimensions="ga:deviceCategory" sort="-ga:sessions" start-date="yesterday" max-results="7">
  </google-analytics-chart>
</google-analytics-dashboard>
First go to:
https://console.developers.google.com/
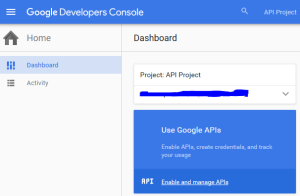
After you login, you will see the following screen. Click on “Use Google APIs“.
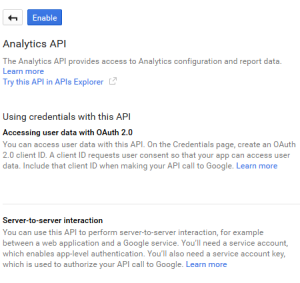
Now, click on “Enable” to start the API Project.
A few seconds later, you will be able to create a new credential for your — Client ID — variable.
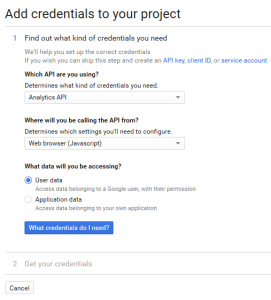
Follow the step-by-step process filling all the necessary field. Click on “What credentials do I need?” to continue.
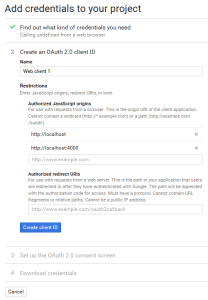
Here you will create an OAuth 2.0 client ID. Give it a name. If you are still running the project locally in your machine, you still can use http://localhost and any specific web server ports — in my case port 4000.
Continue with steps 3 and 4, and download the JSON file for your records. You are done!
Your client ID is the Client_ID_Hashtag.apps.googleusercontent.com
Keep in mind that you can always manage your Google API Credentials through the dashboard.
The best part of all is here:
https://ga-dev-tools.appspot.com/query-explorer/
Allow the Query Explorer to access your GA data and you will be able to fill the remaining variable on the
<google-analytics-chart type="pie" ids="ga:YOUR_ID" metrics="ga:sessions" dimensions="ga:deviceCategory" sort="-ga:sessions" start-date="yesterday" max-results="7">
Now you will be able to get “YOUR_ID”, and create your data tile based on metrics that you want to display.
Here is another piece of metric that you can add in another block of
<google-analytics-chart
  type="area"
  metrics="ga:sessions"
  dimensions="ga:date"
  startDate="30daysAgo"
  endDate="yesterday">
</google-analytics-chart>
A full Polymer Elements Demo can be found HERE.


